Executive Summary
Background and aims:
SHIELD Illinois (or SHIELD) developed an innovative saliva-based COVID-19 test. Recognizing the importance of media as sources of information for the public at times of crisis such as the COVID-19 pandemic, next to providing COVID-19 testing, SHIELD developed and shared campaigns on social and mass media encouraging community-wide testing. This project aimed to understand the effectiveness of SHIELD Illinois' communication about its efforts in terms of media and public response.
We applied persuasive and health communication theories and built on the agenda-setting power of both news and social media to:
Analyze the impact of the SHIELD Illinois activities on public perceptions and media coverage
Understand the diffusion of information about SHIELD Illinois
Method:
Our analysis used a broad range of news and social media platforms, such as Twitter, YouTube, Facebook, Instagram, and Reddit, as well as engagement data from SHIELD’s account holders, which we supplemented with meta data obtained from news databases and platform APIs to gain a comprehensive understanding of user engagement. We also used SHIELD’s testing data to compare media engagement and testing patterns.
Key findings:
-
SHIELD testing, although present across the state, was unevenly distributed with the Chicagoland area dominating. The uptake in testing fluctuated over time.
-
Most media coverage of SHIELD happened in local state news. Notable national outlets that discussed SHIELD included Politico, The New York Times, NPR, and The Wall Street Journal.
-
We identified Twitter accounts that SHIELD tried to engage with, or vice versa, and whether these were reciprocated and noted an imbalance in SHIELD's community engagement and outreach. Engagement with SHIELD developed over time: while SHIELD was most active in the early stages, the community engaged with SHIELD more later during the pandemic.
-
We also found that communication coming from SHIELD and around SHIELD had a positive sentiment. However, there were comments that were negative, even anti-testing.
Project Motivation
SHIELD Illinois (or SHIELD) is an organization behind an innovative saliva-based COVID-19 test. It provides COVID-19 testing, encourages community-wide testing, and helps public health agencies understand the prevalence, contagiousness, and mortality of the disease. The challenge of conducting COVID-19 testing is no longer about inadequate testing capacity but inadequate uptake, due to pandemic fatigue and test anxiety (McDermott & Newman, 2020). To increase the effectiveness of pro-testing campaigns, it is important to understand the dissemination and reach of such messages and the recipients’ perceptions.
Media are an important source of information for the public, especially during health crises, such as the COVID-19 pandemic. However, managing communication and providing adequate health literacy messages is difficult in the contemporary media environment where social media and news media co-exist and can co-shape public agendas (Vargo & Guo, 2017), which can subsequently influence the public’s acceptance of vaccines or willingness to test (Ashkenazi et al., 2020; McDermott & Newman, 2020).
SHIELD Illinois attempted to establish a presence on social media and gain news media coverage. Thus, it became important to understand not only what messages SHIELD Illinois broadcasted but also how the public discussed SHIELD Illinois, how they engaged with its messaging, and how communications about SHIELD Illinois diffused among social networks beyond engaging with its direct communications. Informed by persuasive and health communication and the agenda-setting power of both news and social media, this project was undertaken with the aim to understand the effectiveness of SHIELD Illinois’ communication about its efforts in terms of public response.
Specifically, this project was driven by three research goals:
-
To analyze the impact of the SHIELD Illinois activities on public perceptions and media coverage by answering the following questions:
-
How did social media users react to SHIELD Illinois?
-
What themes dominated the discourse around SHIELD Illinois?
-
What was the media coverage (local and national press) of SHIELD Illinois?
-
To understand the diffusion of information about SHIELD Illinois:
-
Did SHIELD Illinois manage to create a network that would help it diffuse information?
-
Did the information reach the most influential audiences in order to effectively diffuse it further?
Method
Methodological Approach:
This project examines SHIELD Illinois’ digital communication and its associations with COVID-19 testing numbers. Our analysis encompasses a broad range of news and social media platforms, such as Twitter, YouTube, Facebook, Instagram, and Reddit. SHIELD provided us with engagement data from its account holders, which we supplemented with meta data obtained from news databases and platform APIs to gain a comprehensive understanding of user engagement. Below we describe our data collection procedures.
Testing data:
Testing data used in this project began at the end of November 2020 and ended in September 2022. There were 94 weeks of data from all testing sites in Illinois. Although the saliva test began on the UIUC campus in July 2020, our data were limited to the community rollout of the SHIELD Illinois saliva testing.
News coverage data:
News coverage of SHIELD Illinois was gathered using LexisNexis, Newsbank, and Google News. No single platform gave us a comprehensive list of articles; therefore, we combined the results from these three different sources. There were issues with duplicate stories, republished stories, and missing stories from larger news outlets or public media organizations. We used keywords such as “SHIELD Illinois” and “COVID-19” to find news articles from August 2020 to December 2022. LexisNexis and Newsbank were available to us through the university. We first searched for stories through LexisNexis, yielding only 120 articles after duplicates were removed. This number was lower than expected and did not include national outlets that we knew covered SHIELD Illinois. We conducted a search on Newsbank and this search was more thorough, with about 500 articles. However, some national stories were still missing, hence we used Google News to find the larger media outlets like Politico and The New York Times.
Marketing efforts:
influencers hired three Chicago athletes for their testing campaigns. Two were on the women's soccer team, the Chicago Red Stars. Kayla Sharples, a defender for the team, is an Illinois native, originally from Naperville. She attended Northwestern University for soccer. Though she appeared in SHIELD promotions, Sharples did not promote them on Instagram or Twitter. She liked a Tweet from SHIELD mentioning herself. The other Red Stars player, Kealia Watt, midfielder and forward, was on the team from 2020 to 2021. She is originally from Utah and married to football player J.J. Watt, who played for the Texans. Watt also did not post or Tweet anything related to SHIELD. The last influencer hired was former Cubs player Wilson Contreras. He is a catcher and three-time All Star. Contreras was born in Venezuela and attended a Chicago Cubs-run baseball academy in the country when he was 16. Contreras is a popular player, making headlines when he switched to playing for the St. Louis Cardinals. Like Watt and Sharples, Contreras never posted or Tweeted about SHIELD Illinois.
Social media data
Twitter:
Illinois was active on Twitter. We extracted Twitter data using Twitter’s academic API. Twitter can provide rich information about people’s thoughts and feelings about COVID-19 testing, serving as a great starting point for the investigation (Paul et al., 2014).
We applied social network analysis, topic modeling, and sentiment analysis to the Twitter data (see Findings). Social network analysis is the process of exploring social structures via networks and graph theory (see, e.g., Otte & Rousseau, 2002). It reveals the communication between SHIELD Illinois and the Twitter community. We also explored how networks changed over time to better understand the diffusion of health-related information and the change in online engagement. Topic modeling can help organize a large collection of documents by grouping them into different themes. It provides a quantitative account of the topics that the public discusses/engages with. Finally, we used Twitter data to understand the audience’s sentiments, including positive and negative feelings, joy, anger, fear, and trust (Ali et al., 2017; Zarrad et al., 2014).
YouTube:
SHIELD Illinois maintained a YouTube channel with 29 videos published between April 23, 2021 and April 11, 2022. On average, the videos received 3.55 likes (SD = 7.29) and 932 views (SD = 2,462) during this one-year period. The most popular video, “SHIELD Illinois K-12 Schools Collection Examples” (4:22 in length), received 33 likes and 13,221 views. This video showcased two methods for K-12 schools to collect saliva samples for SHIELD Illinois’ COVID-19 test. The second most popular video, “SHIELD Illinois: How the Saliva-Based PCR Test Works” (4:12 in length), received 25 likes and 2,824 views. It demonstrated the step-by-step process that a saliva sample goes through in the PCR testing process, from entering the lab to being disposed of as biohazardous waste. Most videos were brief, with four webinars lasting between 30 minutes and an hour discussing COVID-19 variants, assessing COVID-19 risks for indoor settings, and the effects of long COVID-19. Most videos disabled the commenting function, with only one video receiving a comment asking for assistance in accessing test results online. Therefore, we could not derive meaningful audience engagement/interaction from videos.
Facebook:
March 01, 2021, and September 22, 2022, SHIELD Illinois maintained a Facebook page where they published 153 posts. On average, each post reached out to 514 people (SD = 1,578) and received 10 likes and reactions (SD = 17.00), 1.6 comments (SD = 11.56), and 2 shares (SD = 3.90) during the 18-month period. The most popular post, “If you haven't gotten your post-travel COVID-19 test yet, now’s the time. Don’t wait until you experience symptoms. Be proactive to interrupt the spread!” was published on January 4, 2022 and reached 19,096 Facebook users. It received 181 likes, 143 comments, and 5 shares. This post directed users to the SHIELD Illinois’ website, which provided information about the hours and locations of their testing sites around Illinois. The second most popular post, published on November 18, 2021, encouraged people to help squash COVID-19 before it can spread during Thanksgiving. The post included a flyer that informed users about the nearest testing sites and their hours of operation. Most of the posts on SHIELD Illinois’s Facebook page aimed to promote the importance of getting tested for COVID-19 to prevent the spread of the virus. They offered information about the availability of free testing in different communities, provided educational resources such as webinars, news articles, and presentations from experts to help people understand the different COVID-19 variants and how to prevent their spread, and expressed gratitude to their team and partners for their work in keeping Illinois safe. Facebook data can be sometimes accessed using Facebook’s CrowdTangle. However, in this case, SHIELD Illinois’s Facebook page was not completely public, making it impossible for us to gather the data due to privacy constraints. Therefore, it was not possible to derive meaningful audience engagement/interaction data from the Facebook page.
Instagram:
SHIELD Illinois was present on Instagram and until today has gathered 293 followers and has made 166 posts. We used Facebook’s CrowdTangle to access SHIELD Illinois’ account. SHIELD Illinois posted 161 times between April 22, 2021, and November 22, 2022. The posts were mainly photos, but there were also some videos. They mostly included pictures of tests and testing staff as well as infographics encouraging the audience to get tested. SHIELD has been also tagged in a couple of "sponsored" posts too but not by the influencers they worked with. Since CrowdTangle does not provide access to comments or following accounts for privacy reasons, we did not analyze Instagram.
Reddit:
Upon searching on Reddit, we were unable to find any relevant conversations posted by SHIELD Illinois. However, there were several relevant discussions posted by universities and communities that mentioned SHIELD. Among them, the most popular conversation was posted by the UIUC community, receiving 487 upvotes and 30 comments. This post announced that SHIELD had received FDA approval for its saliva-based COVID-19 test for the campus. The second and third most popular posts were posted by University of Chicago and a Chicago suburbs community, respectively. Both posts mentioned SHIELD in the context of providing information regarding COVID-19 test sites.
Findings
Testing
Before presenting findings related to each of our research goals, we provide our analysis of testing data provided to us by SHIELD Illinois.
COVID-19 Testing in Illinois
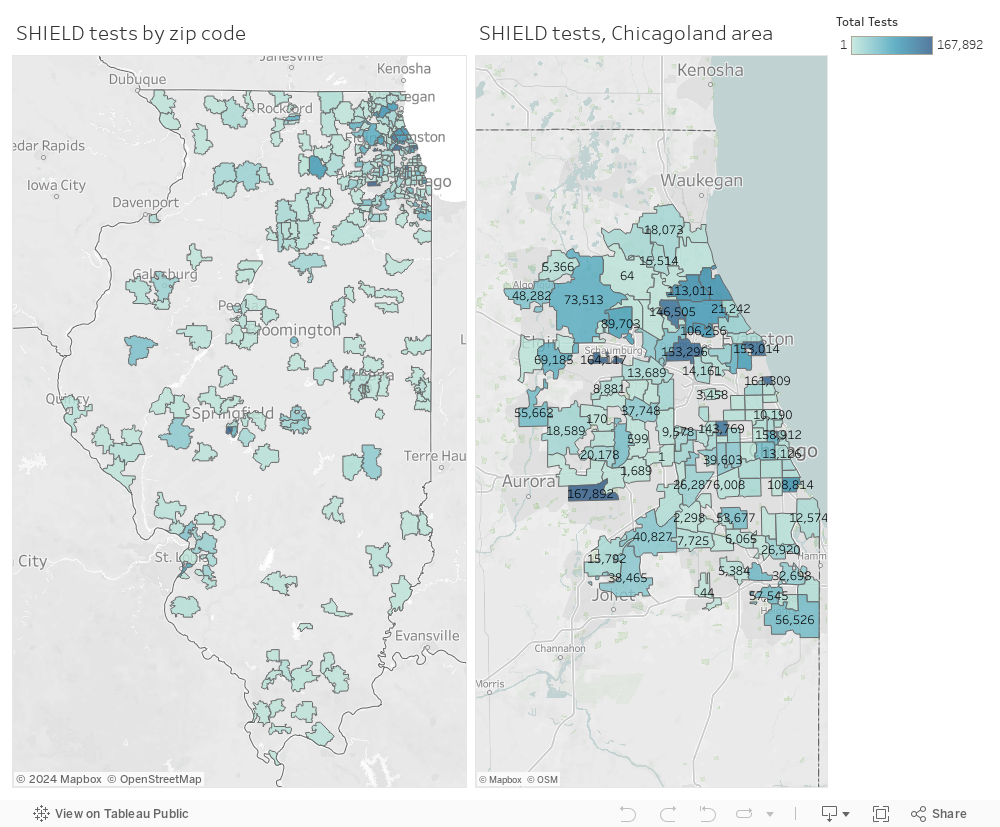
SHIELD Illinois established its presence across the state. SHIELD testing occurred in all regions of the state, with a concentration in the Chicagoland area (see Figure 1). Zip codes outside of the Chicagoland area had somewhat lower total tests, ranging from a few hundred to a few thousands. In the Chicagoland area, the greatest concentration of a high number of tests was in the northern suburbs, such as Highland Park, Northbrook, Wheeling, and Des Plaines. The highest number of tests occurred in zip code 61761, with over 500,000 total tests. This data point was excluded because it is an outlier. The second-highest number of tests was in zip code 60540, which comprises most of Naperville, Illinois.
Figure 1. SHIELD tests by Zip Code. In Illinois (Top). In Chicagoland (bottom). Interactive Tableau
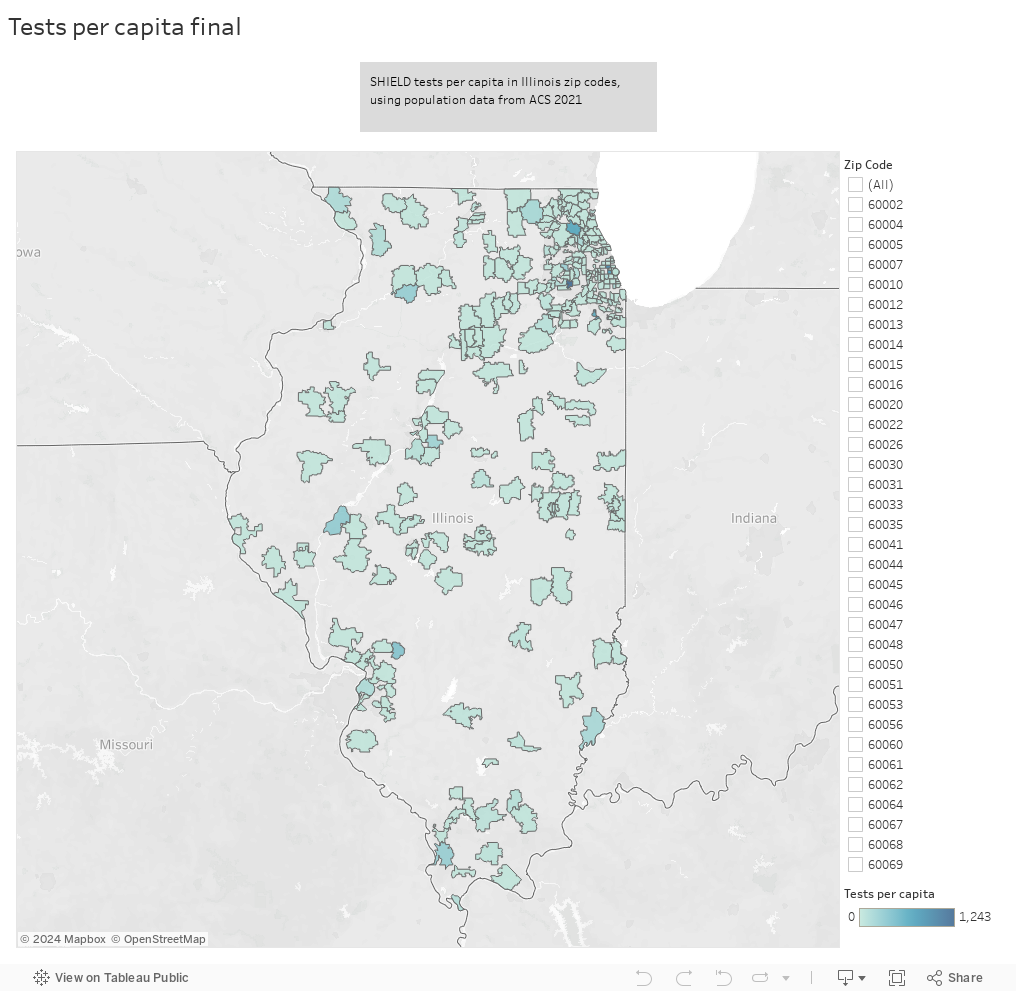
Figure 2 shows SHIELD tests per capita based on populations per zip code from the 2021 American Community Survey. Zip code 60532 had the highest number of tests per capita, located in the town of Lisle, a suburb of Chicago. Higher tests per capita were concentrated in the Chicagoland area.
Figure2. Tests per capita. Interactive Tableau map
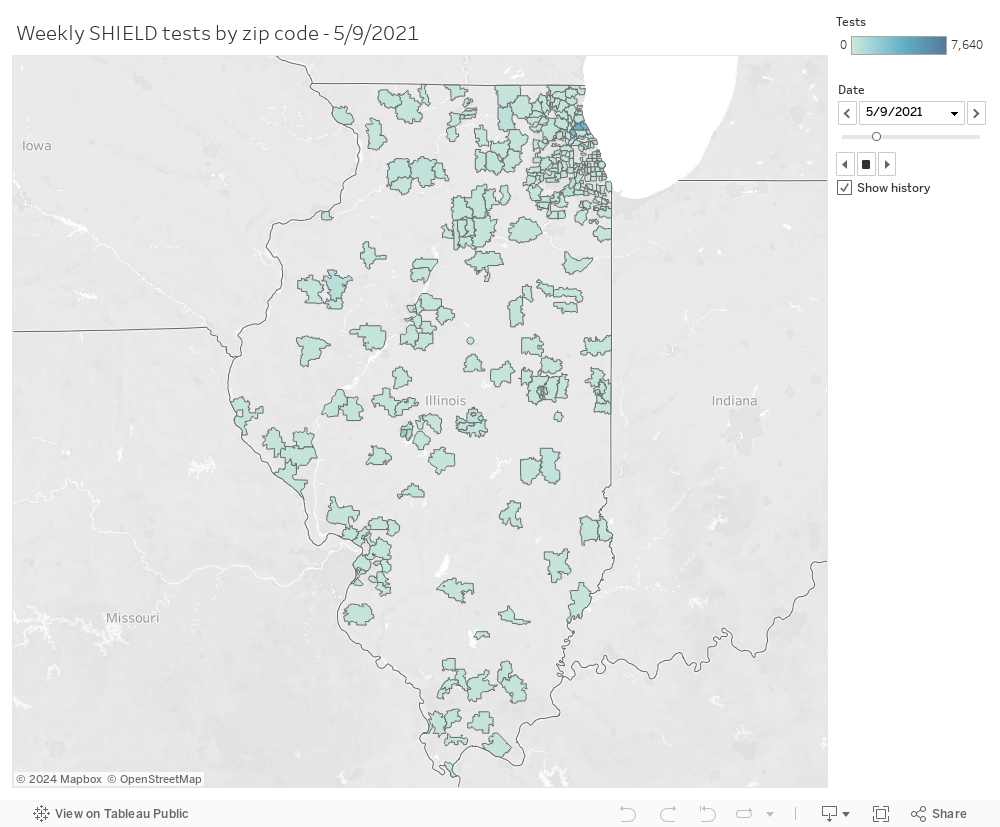
The number of tests changed overtime (see Figure 3). We observe that significant testing didn't occur until the beginning of the school year in August 2021. Testing decreased according to school breaks and the summer months. Testing was distributed throughout most of Illinois, with many Chicagoland zip codes represented.
Figure 3. Tests per week (progressive timeline). Interactive Tableau graph
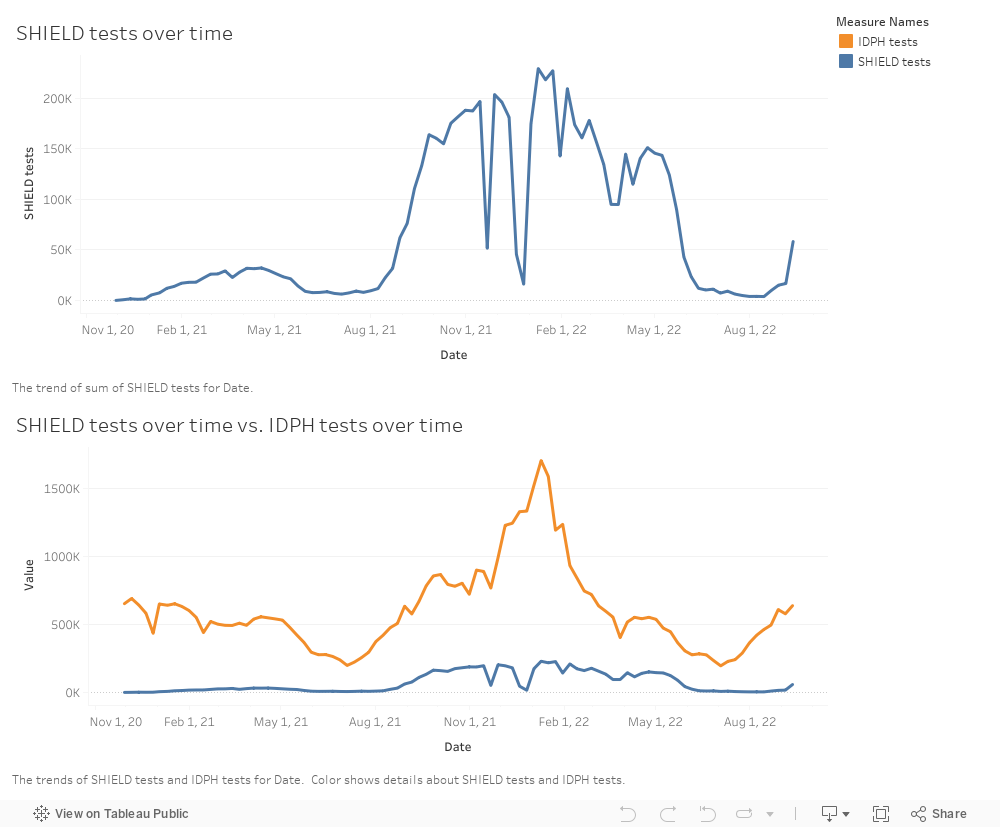
We compared the patterns of IDPH testing and SHIELD testing, showing that they were somewhat similar (see Figure 4). SHIELD only reported significant data starting in August 2021, around when most schools in Illinois begin the term. Testing for both peaked on the same day, Jan. 9, 2022. Sharp decreases in SHIELD testing correspond with typical holiday breaks, like Thanksgiving and winter break, when students are not in school. These decreases were followed by sharp increases in testing, such as the peak of January 9 for SHIELD testing.
Figure 4: SHIELD tests vs. IDPH tests. Interactive Tableau map
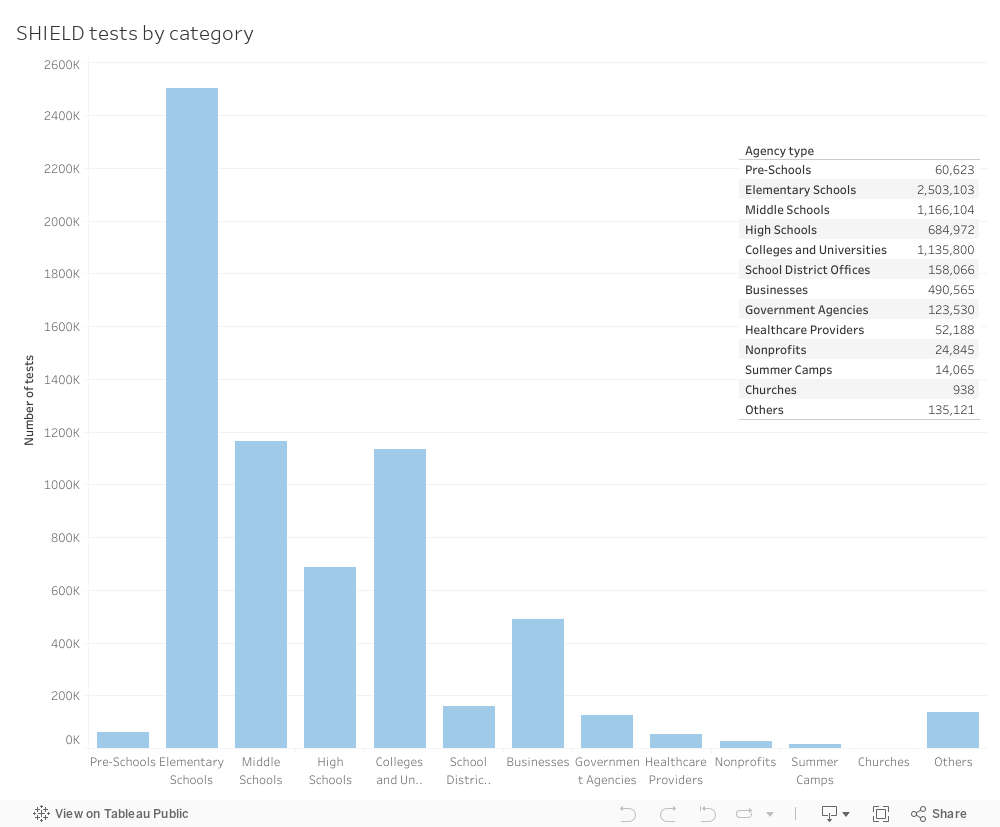
Elementary schools made up most of the SHIELD testing in Illinois with about 2.5 million tests, followed by middle schools then colleges and universities, each conducting about 1 million tests. SHIELD testing primarily targeted schools and universities in Illinois, which is reflected in the testing data. The largest non-school category was businesses, conducting about 500,000 tests total in the studied period. Rivian, the electric car company based in the city of Normal, made up over 400,000 of these tests. Some government agencies included the governor's offices, court systems, and Argonne National Laboratory. The healthcare providers category included various medical offices, hospitals, and rehabilitation centers. The "Other" category is made up of pop-up SHIELD testing sites, vocational schools, community testing sites and family and human services buildings (see Figure 5).
News
News Media Coverage
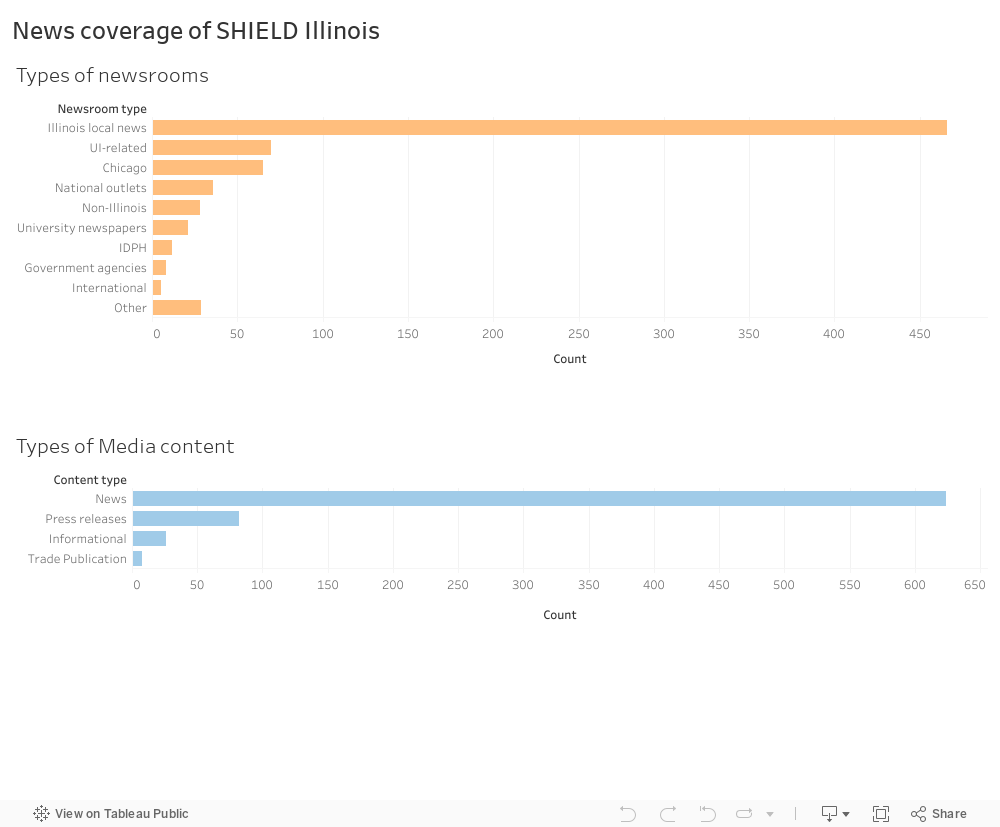
Most of the media coverage of SHIELD Illinois was in local state news, including the Chicago suburbs (see Figure 6). This coverage was mostly in newspapers and their online editions but also included some TV stations and public media organizations. The second-largest type of newsrooms covering SHIELD Illinois were related to the University of Illinois system and their marketing teams. Most were stories on university websites that published articles about the successes of the SHIELD program. The Illinois Department of Public Health and other government agencies wrote various press releases and informational materials on SHIELD testing. Some notable national outlets that covered SHIELD include Politico, The New York Times, NPR, and The Wall Street Journal.
Of the 740 articles and content mentioning SHIELD Illinois, the large majority of them were news articles. A few trade publications, those aimed at industry professionals, discussed SHIELD and vaccination efficiency.
Figure 6: News coverage of SHIELD Illinois. Interactive Tableau chart:
Social
Messaging From and About SHIELD Illinois:
Sentiment analysis
We conducted sentiment analysis to identify the emotions conveyed in the tweets. A score of 0 indicates a neutral valence, a score between 0 and 1 indicates positive sentiment, and a score between 0 and -1 indicates negative sentiment. After analyzing SHIELD's posts, we found that overall, they had a positive sentiment (Mean Sentiment Score = 0.12, SD = 0.13; see Figure 14).

Figure 14. Sentiment of Posts Published by SHIELD Illinois
We looked at the most positive and negative tweets. The most positively valenced message was “All our best to the Red Stars. Proud to call you a partner” (sentiment = 0.571; see Table 2).

Table 2. Top 5 positively valenced posts published by SHIELD Illinois
There were 30 posts with a slightly negative sentiment. The most negative message was “Get tested for Covid-19. Prevent outbreaks before they begin” (sentiment = -0.286; see Table 3).

Table 3. Top 5 negatively valenced posts published by SHIELD Illinois
We further conducted sentiment analysis to understand the emotions conveyed in posts mentioning SHIELD Illinois within the community. Our analysis revealed that these posts also had a positive valence (Mean Sentiment Score = 0.086, SD = 0.14, Figure 15).

Figure 15. Sentiment of Posts Mentioning SHIELD Illinois
The most positively valenced post said, “All our best to the Red Stars. Proud to call you a partner!” (sentiment = 0.571; Table 4).

Table 4. Top 5 positive valenced posts published by the community
There were also 147 slightly negative posts, with the most negative post stating “@SHIELDIllinois @SenDuckworth Criminal fraud.” (sentiment = -0.5; Table 5). Overall, the sentiment analysis suggests that the community had a positive view of SHIELD Illinois, but there were also negative opinions that should be addressed.

Table 5. Top 5 negative valenced posts published by the community
Emotion Analysis
We conducted emotion analysis of the posts published by the SHIELD account (Figure 16) and those that mentioned @SHIELDIllinois (Figure 17). The histogram suggests that posts mentioning @SHIELDIllinois contained a higher proportion of negative emotions, such as anger, disgust, fear, negativity, sadness, and surprise than posts made by SHIELD. However, both posts by SHIELD and those mentioning @SHIELDIllinois also included positive emotions, such as trust and anticipation, and to a lesser extent, joy and fear.

Figure 16. Emotion Analysis of posts published by SHIELD Illinois

Figure 17. Emotion Analysis of posts mentioning SHIELD
Topic Modeling
We conducted an analysis of the most frequent words that appeared among posts published by SHIELD (Figure 18) and those by the community (Figure 19) and constructed two “word clouds.” Our findings indicate that posts published by SHIELD mainly focused on testing instructions, such as where (e.g., site) and when (e.g., holiday, today, week, hour) to get the test.

Figure 18. Word cloud of SHIELD’s posts
Conversely, posts published by the community primarily focus on the community itself. Some frequent words used by the community include school, kid, student, community, and district.

Figure 19. Word cloud of community’s posts that mentioned SHIELD
We conducted topic modeling analysis of the posts published by SHIELD (Figure 20) and the community (Figure 21) to understand the key themes. The posts published by SHIELD revealed two clusters of words, which were consistent with the word cloud analysis. The first cluster focused on testing instructions, such as when (e.g., time, hours) and where (e.g., sites, Chicago, tour) to get the test. The second cluster highlighted the benefits of testing for the community, including schools, districts, and students.

Figure 20. Topic modeling analysis of posts published by SHIELD
Similarly, the posts published by the community (Figure 21) also revealed two clusters of words. The first cluster centered around the community (e.g., Chicago, students), while the second cluster focused on the testing sites (e.g., staff, PCR, team).

Figure 21. Topic modeling analysis of posts published by the community
The discrepancy between the themes derived from the posts published by SHIELD and the community reflects a slightly different emphasis of these two groups. SHIELD primarily focused on providing utilitarian information that facilitates public testing, while the posts published by users primarily focused on the communities and groups.
Correlation with Public Behavior
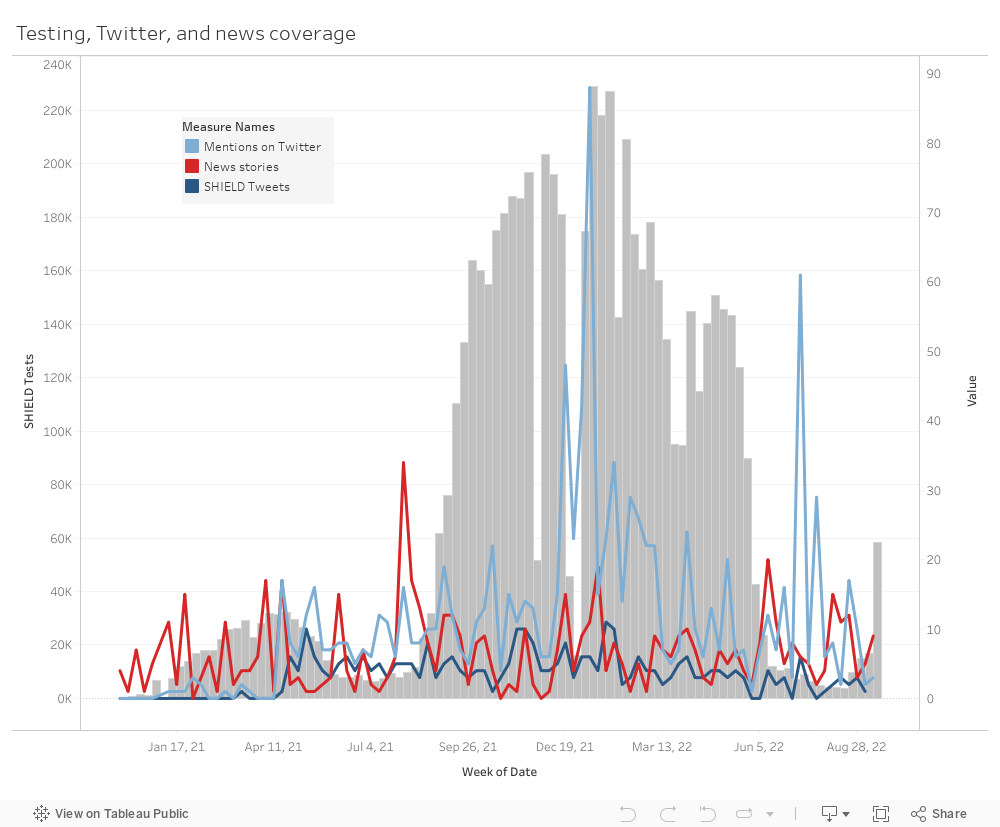
Finally, we were curious about the associations between the communication patterns and actual testing behaviors. As visualized in Figure 22, the highest number of tests coincided with the highest number of mentions on Twitter during the week of January 16, 2022. There doesn't appear to be persistent patterns among the different measures of testing, Twitter activity, and media coverage. Except for news stories, where increases and decreases did align with testing changes from September 2021 to the end of May 2022. Most news stories were published during the first week of August 2021, presumably right before the start of the academic school year when a lot of school districts began implementing SHIELD testing.
Figure 22: Testing, Twitter, and news coverage. Interactive Tableau graph:
SHIELD Illinois on Twitter
SHIELD Illinois’ Network
According to the Twitter data we gathered, the official account of SHIELD Illinois published 308 tweets between March 19, 2021, and September 5, 2022, and mentioned 68 Users (see Figure 7). The most-frequently mentioned user was an Associate Professor at the University of Illinois, who was also involved in the University's COVID-19 response team, and who was mentioned 14 times. The second-most frequently mentioned account was @UofIllinois, which was mentioned 8 times.
We conceptualized the Twitter data as a mention network, where each Twitter handle is a node, and the nodes are connected to one another by the frequency of one mentioning the other. For example, if during the period of analysis, SHIELD mentioned UIUC 5 times, the connection from SHIELD to UIUC would have a strength of 5. Conversely if in the same period, UIUC mentioned SHIELD 3 times, the strength of the connection from UIUC to SHIELD would be 3. Thus, this is a directed and weighted network.

Figure 7. Twitter accounts mentioned by SHIELD Illinois
The frequency with which Twitter users were mentioned by SHIELD Illinois changed over time. We divided the analysis duration into three equal time periods and explored the number of accounts that SHIELD Illinois mentioned in their posts. Figures 8-10 present the non-accumulative number of users mentioned by SHIELD Illinois within each period, reflecting their outreach attempts across different time periods. Between March 19, 2021, and March 11, 2022 (periods 1 and 2), we found 67 mentions of 60 different accounts in SHIELD Illinois's posts. In the last period, we found 16 mentions of 8 accounts in SHIELD Illinois's posts. The data showed that SHIELD made a greater effort to engage with communities before March 2022 but spent slightly less effort interacting with them after that.
.png)
Figure 8. SHIELD outreach between 2021-03-19 ~ 2021-09-14 (period 1)
.png)
Figure 9. SHIELD outreach between 2021-09-14 ~ 2022-03-11 (period 2)
.png)
Figure 10. SHIELD outreach between 2022-03-11 ~ 2022-09-05 (period 3)
Our analysis of Twitter data revealed that the @SHIELDIllinois account was mentioned (either in the original posts or replies) in 1,100 tweets between January 14, 2021, and October 12, 2022. We further analyzed the data by excluding replies mentioning @SHIELDIllinois, retaining 575 tweets where the account was mentioned in the original posts. We divided the time span into three equal periods, and Figures 11-13 present the non-accumulative number of users mentioned by the @SHIELDIllinois account within each period. These figures help demonstrate the effectiveness of SHIELD's outreach attempts and how the community engaged with SHIELD in their communication.
We found that one account mentioned SHIELD 44 times. This account belonged to a board member of the Valley View School District in Bolingbrook, a Chicago suburb, and most of their COVID-19 posts had an anti-vaccine and anti-masks sentiment. @UofILSystem and another user mentioned SHIELD 25 and 19 times, respectively. Between August 14, 2021, and March 14, 2022 (period 2), there was a significant increase in the frequency of @SHIELDIllinois being mentioned in others' posts (an increase of 284), demonstrating the effectiveness of SHIELD's community engagement.
 .png)
Figure 11. Community Engagement between 2021-01-14 ~ 2021-08-14 (period 1)
 .png)
Figure 12. Community Engagement between 2021-08-14 ~ 2022-03-14 (period 2)
.png)
Figure 13. Community Engagement between 2022-03-14 ~ 2022-10-12 (period 3)
In addition, we calculated the source-target dyad reciprocity score for accounts that interacted with SHIELD on Twitter. This score represents the proportion of times that the edge between two nodes is reciprocated, or the proportion of times that a directed edge goes in both directions. It is a measure of the symmetry or balance in the relationship between the two nodes (Table 1). A higher score indicates more two-way conversations between the Twitter user and SHIELD. In other words, reciprocity measures the extent to which SHIELD's mentions were reciprocated.
Our analysis found that the Twitter user who was mentioned the most in the official tweets of SHIELD Illinois was not the same user who mentioned SHIELD Illinois the most in their posts. This indicates an imbalance in SHIELD's outreach efforts and community engagement. The source-target dyad reciprocity score also suggests that SHIELD can improve its efforts to engage in meaningful conversations with key opinion leaders.

Table 1. Two-way communications between SHIELD and users from community
We now look at who SHIELD engaged with and who engaged with SHIELD. Some of the top accounts that interacted with SHIELD on Twitter included people affiliated with school districts, including parents. The top account was a person who frequently Tweeted about COVID-19, and his anger with COVID-19 policies, like masks and vaccine requirements. The University of Illinois was the only college system that mentioned SHIELD and Valley View District in Bolingbrook (Chicagoland suburb) was the only school district. UIUC professors also frequently mentioned SHIELD, including epidemiologist Rebecca Lee Smith and biology professor Mark Pickering. Illinois Governor J.B. Pritzker and a journalist also mentioned SHIELD. The other individuals were people who seemed to be against mask mandates or promoted conspiracy theories surrounding the government's involvement in spreading COVID-19.
The SHIELD Illinois account only mentioned accounts affiliated with their testing program, such as the University of Illinois system, Northeastern Illinois University, and the Illinois Department of Public Health. Two media organizations were mentioned as well: WTTW in Chicago and Scientific American. SHIELD also mentioned the Chicago Red Stars and Wilson Contreras, professional sports teams that did marketing promotion for SHIELD.
Conclusion
Our results show that SHIELD testing was present across the state, but it was unevenly distributed with the Chicagoland area dominating. The uptake in testing fluctuated over time. Future projects may want to better understand the differences in testing across the state. These differences may be driven by various reasons, including news outlets, community information sources, population differences in political attitudes, and more. When it comes to media coverage of SHIELD, most of it happened in local state news, suggesting that significant attention should be paid to information dissemination in local outlets. We identified Twitter accounts that SHIELD created relationships. Our results indicated an imbalance in SHIELD’s outreach efforts and community engagement. SHIELD was not able to create reciprocal relationships with some important accounts that could have helped it disseminate their communication further. Future projects may want to better understand how communication should be crafted in order to reach farther and deeper, including influential accounts. At the same time, there were accounts that tried to engage with SHIELD, but SHIELD did not respond. Some of these accounts represented anti-testing and anti-mandate sentiment, suggesting that future projects may want to investigate the role of misinformation in the willingness to test. Also, strategies to deal with such engagement should be developed. We also noticed that engagement with SHIELD developed over time: while SHIELD was most active in the early stages, the community engaged with SHIELD more later during the pandemic. This suggests that for this type of communication to be successful, an organization needs to monitor engagement and respond when there is an increased need for information in the public. Finally, we found that communication coming from SHIELD and around SHIELD had a positive sentiment. However, there were comments that were negative, even anti-testing. Previous research suggests that negative communication may be more influential and viral. It is important to understand what type of communication would be more successful to improve our response to future health crises.
Team
Ewa Maslowska (Ph.D., Communication Science, University of Amsterdam) is an assistant professor in the Charles H. Sandage Department of Advertising and an affiliate faculty member in the Institute of Communications Research and Illinois Informatics. Ewa conducts experiments and analyzes digital trace data to understand the effects different types of communication have on people. She is particularly interested in personalization, algorithmic systems, and consumer engagement.
Yee Man Margaret Ng (Ph.D., University of Texas) is an Assistant Professor in the Department of Journalism and Department of Computer Science (faculty affiliate) at The University of Illinois Urbana–Champaign. Her research examines technology use, social media, and information diffusion using large-scale, unstructured data and computational methods. She was an Infodemics Researcher with United Nations Global Pulse, an innovation initiative of the UN Secretary-General to harness big data and emerging communication technologies for sustainable development and humanitarian action.
Harsh Taneja (PhD. Media, Technology & Society, Northwestern University) is an Associate Professor of New and Emerging Media at the College of Media in the University of Illinois Urbana-Champaign and a faculty affiliate in Informatics. An expert in network analysis, he interested in how people consume media in an environment where they purportedly have plenty of choice. Within this broader question, his work focuses on global internet audiences, as well as how people consume news on digital media.
Rik Ray is a doctoral student at the Institute of Communications Research at the University of Illinois at Urbana-Champaign. His research currently focuses on the changing dynamics of news media environments and how media audiences navigate them. Relying primarily on empirical research methods, he eventually aims to contribute to policy deliberations concerning internet governance, financial communication, and consumer protection in the global South.
Chen (Crystal) Chen is a Ph.D. candidate from the Institute of Communications Research at the University of Illinois at Urbana-Champaign. Her research focuses on individuals' attention, motivation, and decision-making in immersive experiences such as AR/VR, games, and narratives. To investigate this, she employs both behavioral research methods and formal modeling techniques. Her aim is to refine and modernize the theoretical constructs related to immersive experiences in order to provide a clearer understanding of their role in modulating media selection and effects. Through her work, she hopes to assist users in developing appropriate media skills and making informed decisions when engaging with complex and immersive media experiences.
Vivian La is a senior majoring in Journalism with a minor in Integrative Biology. She works at The Daily Illini as an assistant news editor and serves as president of UIUC's chapter of the Asian American Journalists Association. Vivian has done some qualitative research on oral histories and generational trauma. She is interested in science journalism and has done print and radio reporting on topics like racism against Asian Americans, the 2020 presidential election, and fish elevators. This summer, she will be a reporting intern at The Chicago Tribune
Rishab Doshi is a sophomore pursuing a bachelor's degree in Computer Science and Advertising at the University of Illinois at Urbana-Champaign. As a member of the MUSE Lab, he contributes to projects involving web scraping, sentiment analysis, and web development. With an entrepreneurial spirit and commitment to making a positive impact, Rishab seeks opportunities to apply his skills to real-world projects. With his technical expertise, entrepreneurial mindset, and dedication, Rishab is poised to make significant contributions in computer science and advertising.
Anisha is pursuing her Masters in Information Management at the University of Illinois, Urbana Champaign. She is interested in data science and analytics with a focus on text mining and consumer behavior analysis. Currently, she is working on designing a machine learning based algorithm using search intent to predict search clicks.
Elements
Text
This is bold and this is strong. This is italic and this is emphasized.
This is superscript text and this is subscript text.
This is underlined and this is code: for (;;) { ... }. Finally, this is a link.
Heading Level 2
Heading Level 3
Heading Level 4
Heading Level 5
Heading Level 6
Blockquote
Fringilla nisl. Donec accumsan interdum nisi, quis tincidunt felis sagittis eget tempus euismod. Vestibulum ante ipsum primis in faucibus vestibulum. Blandit adipiscing eu felis iaculis volutpat ac adipiscing accumsan faucibus. Vestibulum ante ipsum primis in faucibus lorem ipsum dolor sit amet nullam adipiscing eu felis.
Preformatted
i = 0;

while (!deck.isInOrder()) {
    print 'Iteration ' + i;
    deck.shuffle();
    i++;
}

print 'It took ' + i + ' iterations to sort the deck.';
Lists
Unordered
- Dolor pulvinar etiam.
- Sagittis adipiscing.
- Felis enim feugiat.
Alternate
- Dolor pulvinar etiam.
- Sagittis adipiscing.
- Felis enim feugiat.
Ordered
- Dolor pulvinar etiam.
- Etiam vel felis viverra.
- Felis enim feugiat.
- Dolor pulvinar etiam.
- Etiam vel felis lorem.
- Felis enim et feugiat.
Icons
Actions
Table
Default
| Name |
Description |
Price |
| Item One |
Ante turpis integer aliquet porttitor. |
29.99 |
| Item Two |
Vis ac commodo adipiscing arcu aliquet. |
19.99 |
| Item Three |
Morbi faucibus arcu accumsan lorem. |
29.99 |
| Item Four |
Vitae integer tempus condimentum. |
19.99 |
| Item Five |
Ante turpis integer aliquet porttitor. |
29.99 |
|
100.00 |
Alternate
| Name |
Description |
Price |
| Item One |
Ante turpis integer aliquet porttitor. |
29.99 |
| Item Two |
Vis ac commodo adipiscing arcu aliquet. |
19.99 |
| Item Three |
Morbi faucibus arcu accumsan lorem. |
29.99 |
| Item Four |
Vitae integer tempus condimentum. |
19.99 |
| Item Five |
Ante turpis integer aliquet porttitor. |
29.99 |
|
100.00 |